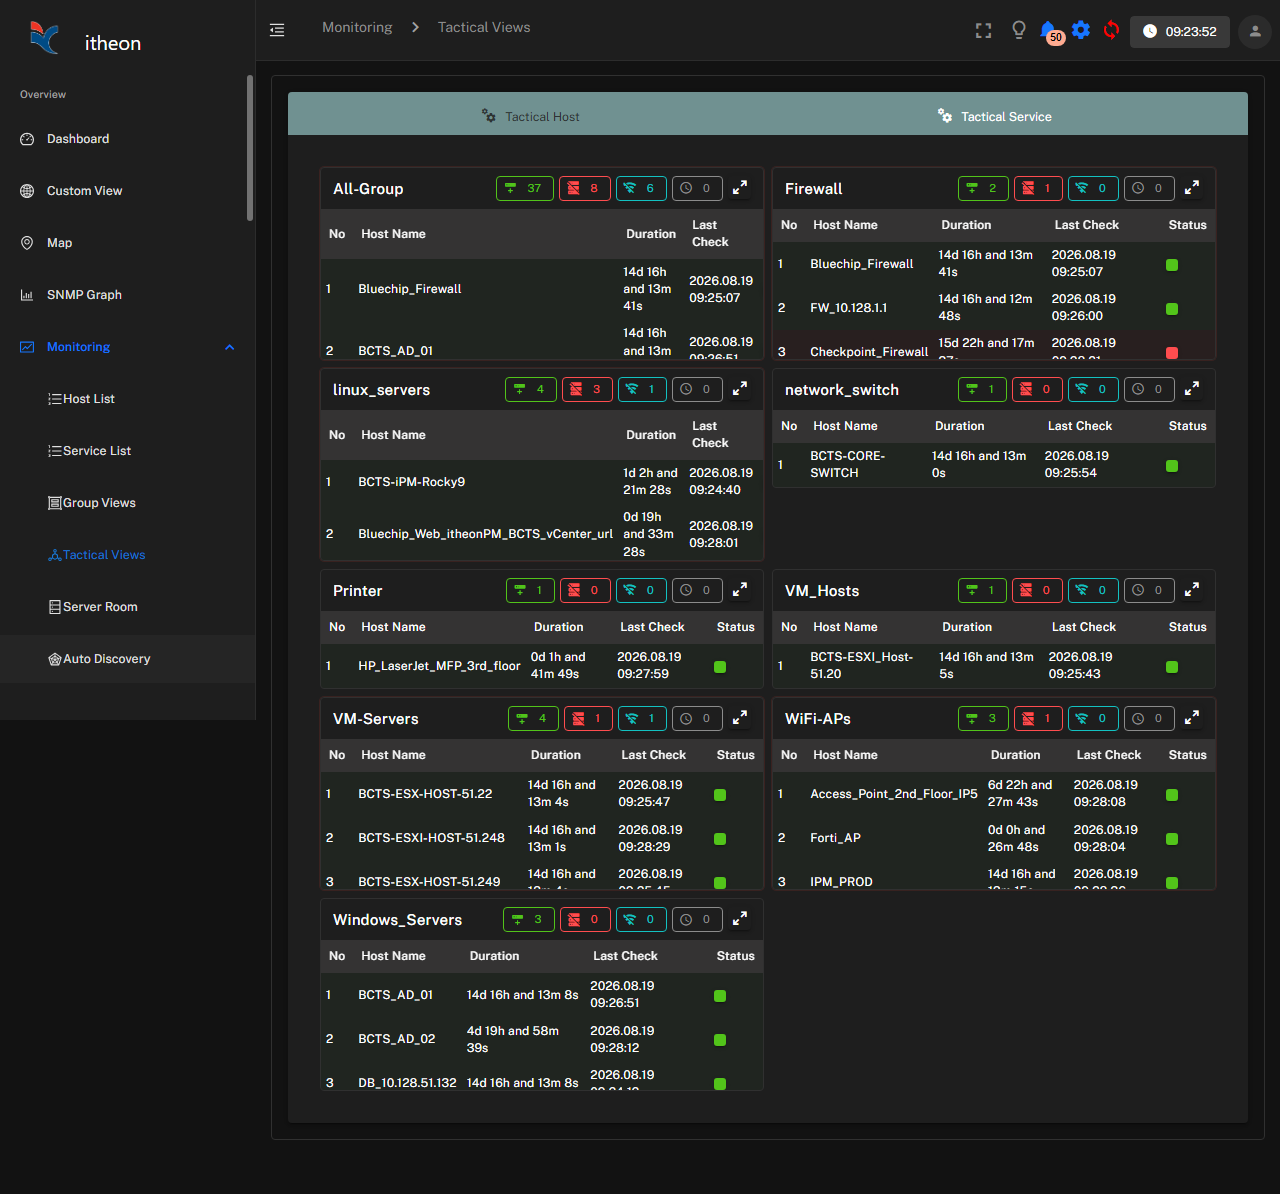
The default dashboard is a good general-purpose view, but most teams eventually want something more specific — a NOC display that only shows critical infrastructure, a per-site view for a regional team, or a lightweight SLA summary for management. That's what custom dashboards are for.
Creating a custom dashboard
- From the dashboard area, choose the option to create a new dashboard.
- Give it a clear, specific name (for example, "Colombo Site — Network" or "Executive SLA Summary") so it's easy to find later.
- Add widgets one at a time, using whichever mix of the types covered in Dashboard Widgets fits the purpose of this dashboard.
- Arrange and resize widgets until the layout reads well at a glance, since a dashboard that requires scrolling and hunting defeats the purpose.
- Save the dashboard.
Good candidates for a custom dashboard
- A NOC / operations view showing only Down and Critical status, with no clutter
- A per-site or per-region dashboard, scoped with a host group filter
- An application-focused dashboard, combining service status and performance graphs for a specific business system
- A management-facing dashboard built mostly from Availability/SLA widgets, with technical detail left out
Sharing and access
Custom dashboards can be set as your personal default, or shared so a whole team lands on the same view. If your organization uses Roles & Permissions, check with an administrator about who can edit a shared dashboard versus who can only view it, so one person's changes don't unexpectedly affect everyone else's screen.
Once you have a custom dashboard you rely on daily, use Dashboard Filters to fine-tune exactly what it shows without having to rebuild it from scratch.