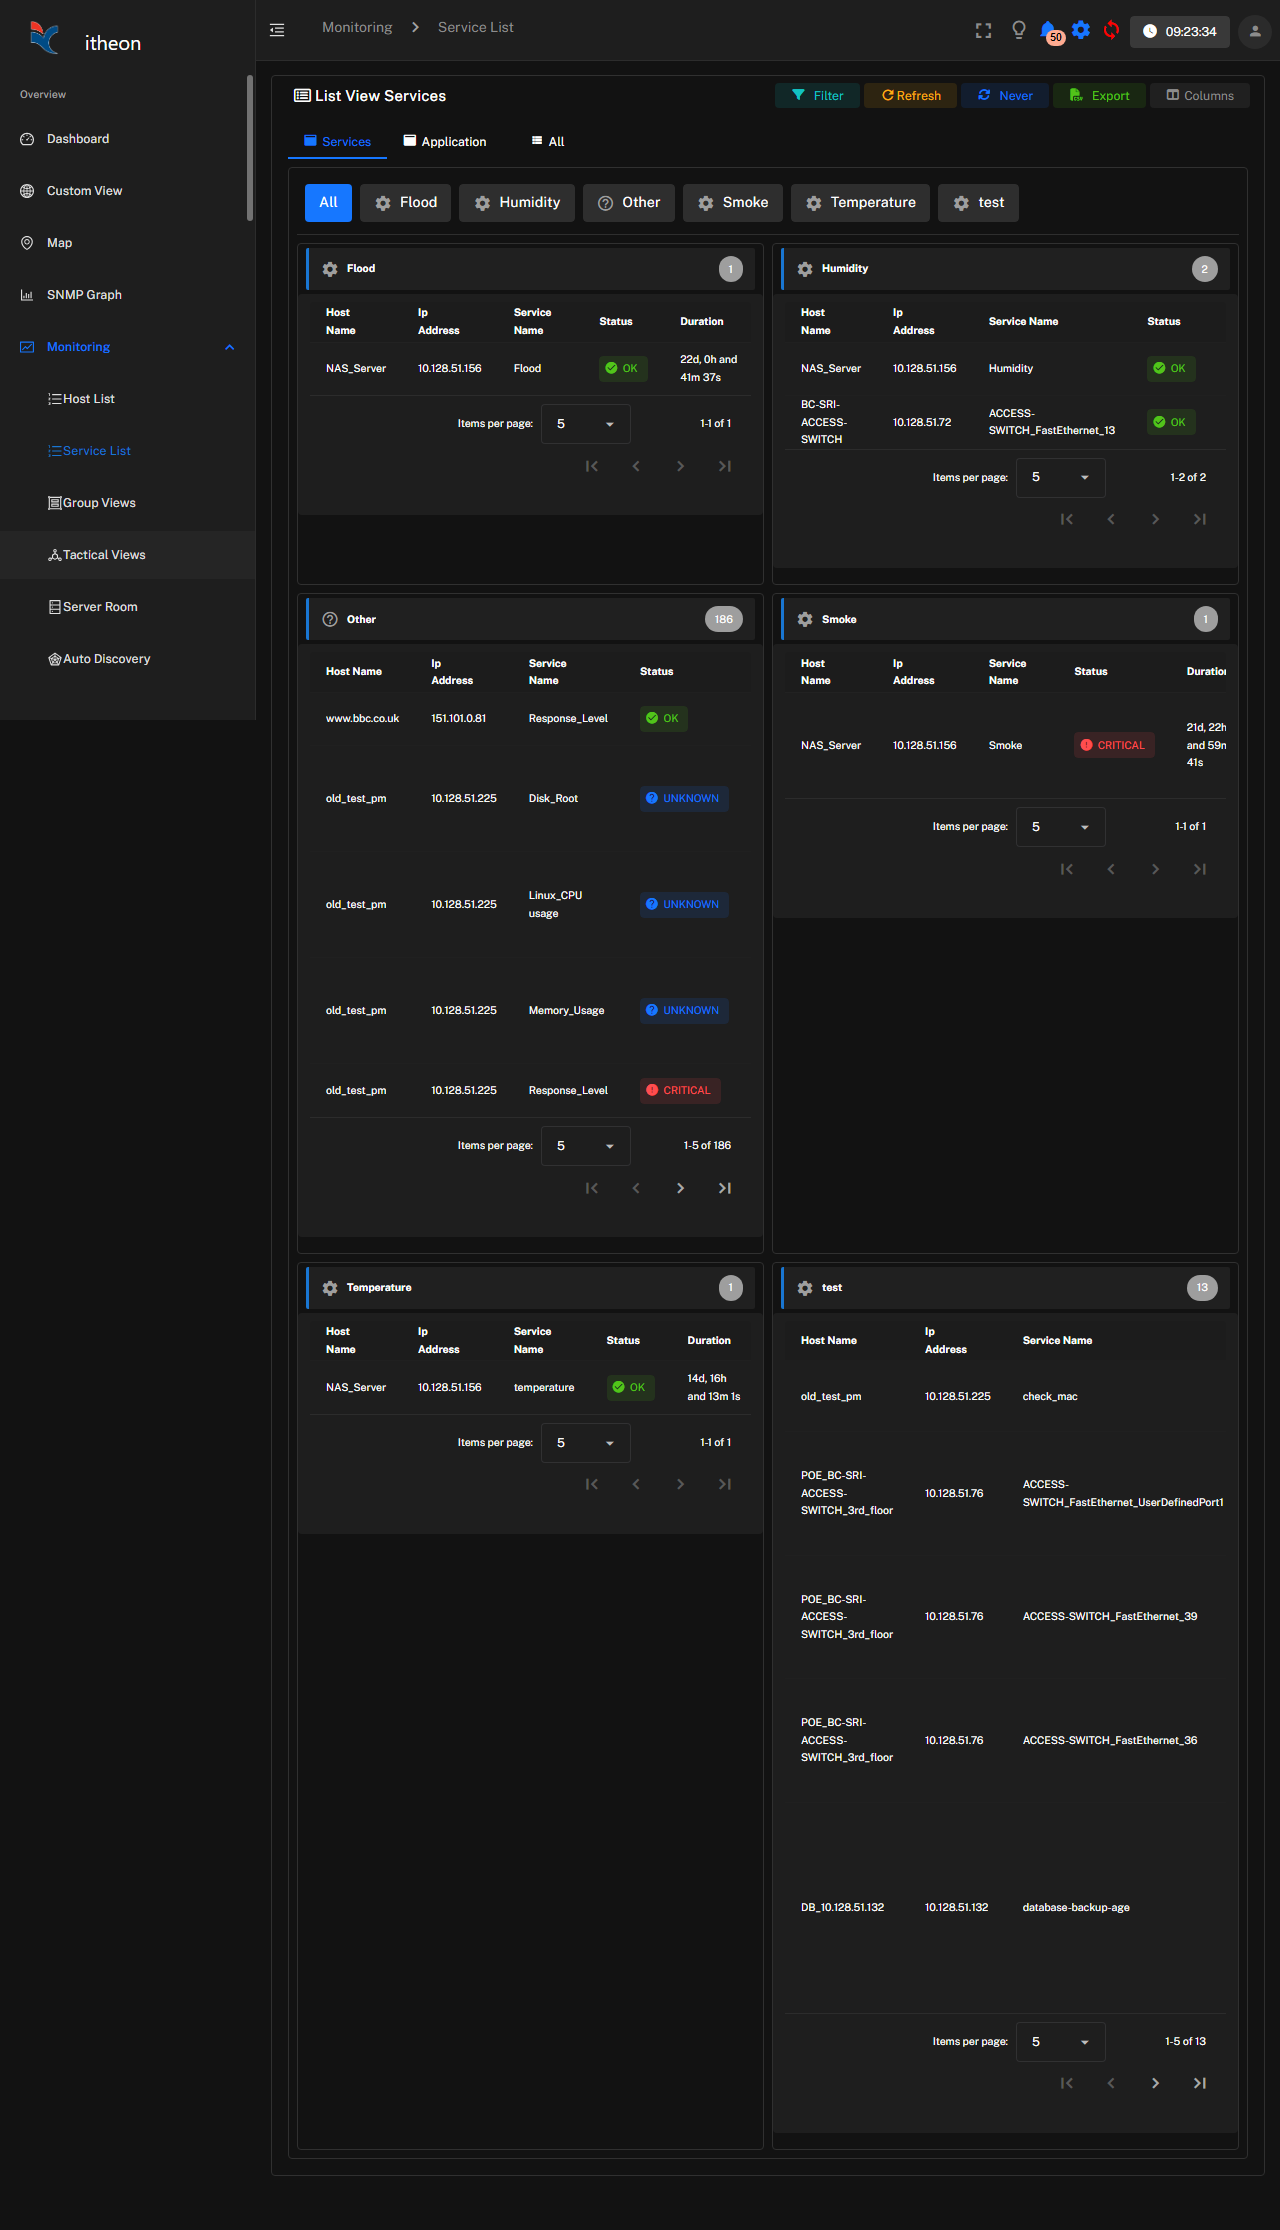
A server can look perfectly healthy — CPU, memory, and disk all fine — while the application running on it is unresponsive, slow, or serving errors. Application monitoring in iPM exists to catch exactly that gap, by checking the service itself rather than only the infrastructure underneath it.
Ways iPM checks an application
- Process check — is the expected process actually running on the host
- Port / TCP check — is the application listening and accepting connections on its expected port
- HTTP(S) check — does a request to the application return a healthy status code (and optionally, within an acceptable response time)
- Service-specific metrics — many common application servers expose their own status endpoint or management interface with richer detail than a simple up/down check; iPM has more specific guidance for:
- Apache
- Nginx
- Tomcat
- PHP (PHP-FPM)
- RabbitMQ
If you're running something not covered by one of those specific articles, the generic process, port, and HTTP checks above still apply and cover the majority of what most applications need.
Why this matters for alerting
Application-level checks tend to catch real user-facing problems faster than infrastructure checks alone — a web server can be "Up" at the host level for hours after its application process has actually crashed or hung. Pairing a host-level check with an application-level one on the same service gives you both halves of the picture: whether the server is reachable, and whether what's running on it is actually working.
Application checks show up in the same host/service model as everything else in iPM, so they appear in dashboards, get covered by alert rules, and show up in availability reports exactly like a network device or a CPU check would.