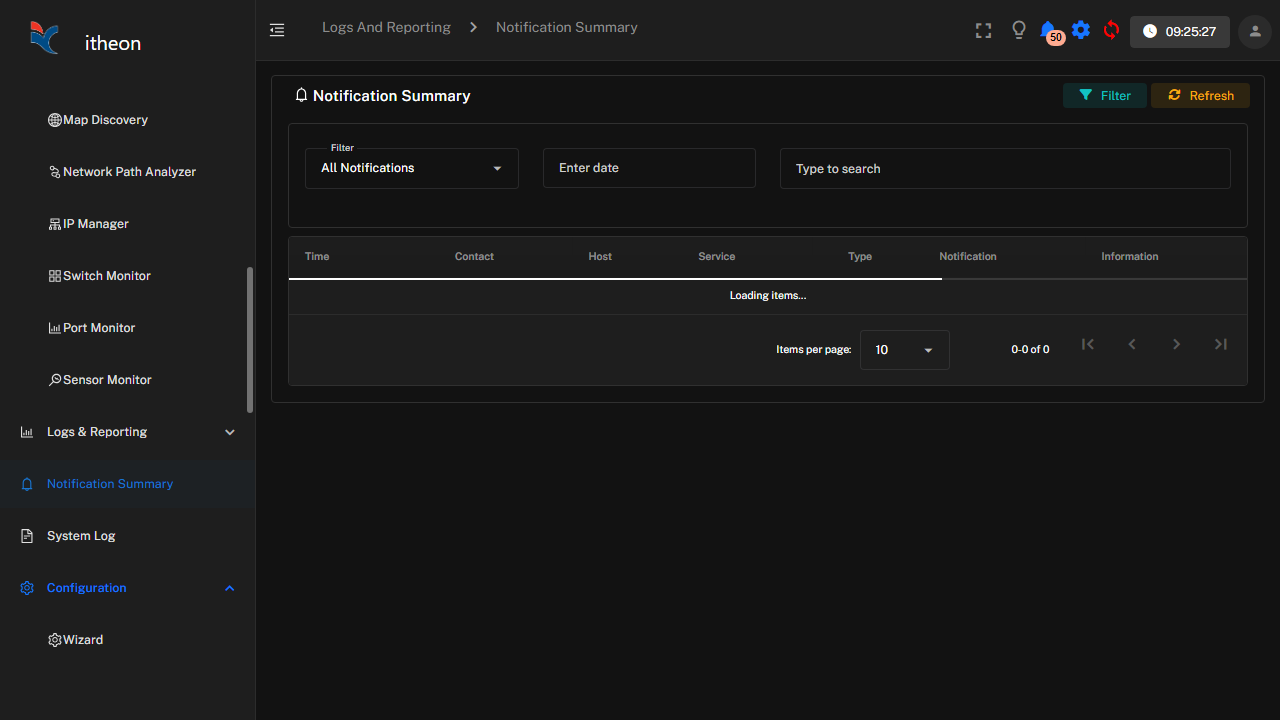
Every alert iPM raises is recorded, not just surfaced in the moment — Alert History is where that record lives, and it's useful for far more than just looking something up after the fact.
What's in the history
Each entry records the host or service involved, when the alert fired and when it cleared, its severity, and who (if anyone) acknowledged it. The list can be filtered by host, host group, time range, and severity, so you can narrow it down to exactly what you're investigating rather than scrolling through everything.
Common uses
- Incident review — confirming what actually happened, in what order, and how long it took to acknowledge and resolve, after a significant outage
- Spotting recurring problems — a host that shows the same alert repeatedly over weeks is telling you something a single incident report won't: that the underlying condition (not just one occurrence of it) needs fixing
- Catching flapping that slipped through — even with flapping detection in place, a review of history can reveal a check that's been unstable longer than anyone noticed day to day
- Confirming maintenance windows worked as expected — checking that a scheduled change didn't generate unexpected alerts, or that expected ones were correctly suppressed
Alert history versus availability reporting
Alert History gives you the raw, detailed event log; the Reports section (particularly Performance Reports and SLA Reports) turns that same underlying data into summarized, presentation-ready figures over a chosen period. Use history when you need to know exactly what happened and when; use reports when you need to communicate the bigger picture to someone who wasn't in the middle of the incident.